DATA VISUALIZATION IN TABLEAU
This session features data visualization and story telling using Tableau

Data & Business Intelligence Analyst Experienced in the use of Tableau, SQL, Excel, Python and Power BI
LinkedIn Tableau_public
.
This session features data visualization and story telling using Tableau

This data analysis and story telling explores ways by which ChemCorp Incorporated can grow its Market share and Profitability as Management seeks to optimize revenue generation across all areas of operation while improving efficiency.

This Data Visualization seeks to tell a story on how the AEMR can improve efficiency while reducing losses. Specifically, it aims to help AEMR Management team to address
1. Energy Instability & Market Outages and
2. Energy Losses and Market Reliability.
After using SQL to extract the relevant data needed from the database, I use tableau to help Management solve these critical challenges.
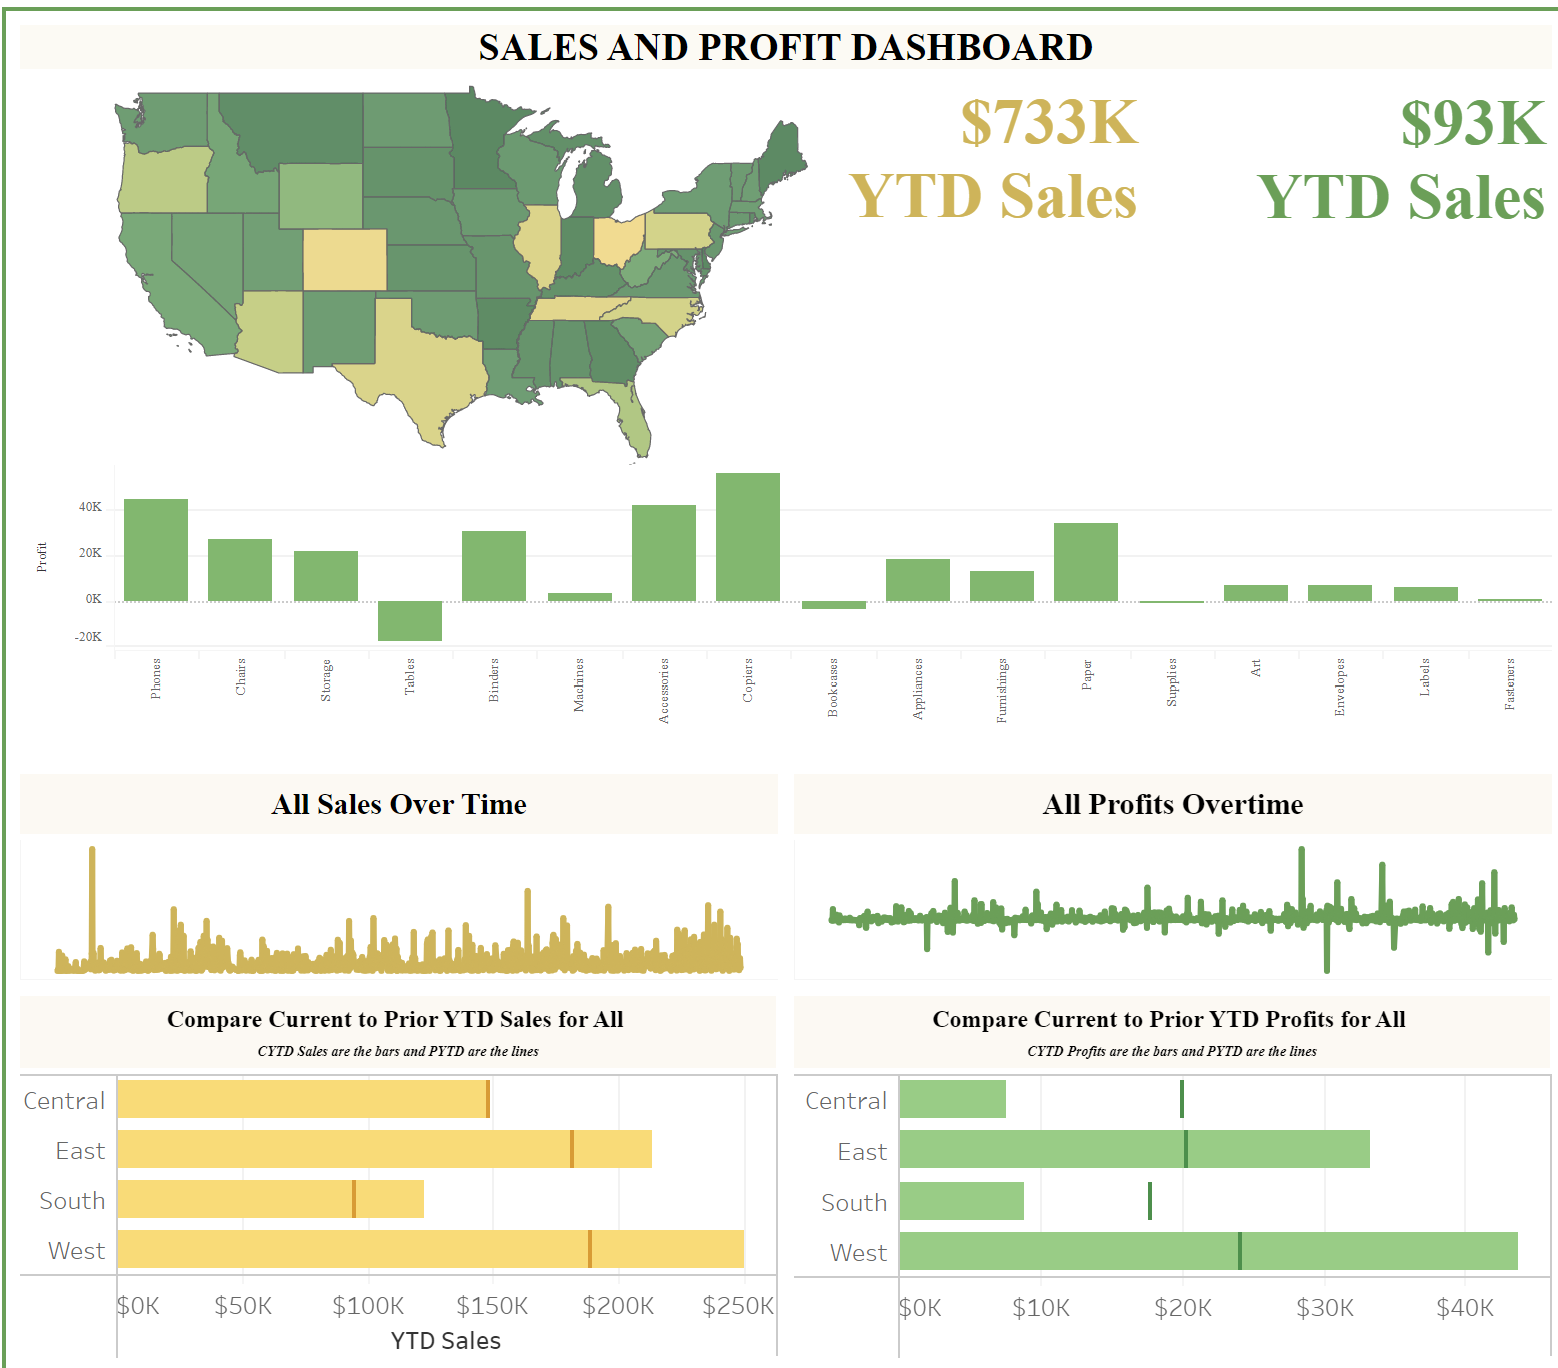
This interactive Dashboard offers Management quick insights on how important areas of the Store are faring with respect to sales and profitability.

This Dashboard offers a brief insight on how each Region, State or Age Group impact Walmart's Average Profitability.

This Analysis seeks to tell a story on the following:
1. Hotel Bookings affects revenue and Losses
2. Use Client ratings to identify customer segment needing the most attention.